Log #79 · Oct 19, 2026
Using a Cheap Logic Analyzer to Debug I2C, SPI and Serial
How an 8-channel USB logic analyzer and the free PulseView software let you see and decode the digital signals between your Arduino and its modules, with setup steps and a first I2C capture.
When an I²C sensor "isn't found" or a display shows garbage, the Serial Monitor can only tell you what your code thinks is happening. A logic analyzer shows what's really on the wires: every bit of every byte, with the protocol decoded into readable values. The common 8-channel, 24 MHz USB analyzers cost about as much as a pizza and work with free software.
Logic analyzer vs oscilloscope
| Oscilloscope | Logic analyzer | |
|---|---|---|
| Shows | the real voltage shape | only HIGH or LOW |
| Channels | usually 2–4 | 8 or more |
| Capture length | short | long: seconds to minutes |
| Decodes protocols | some models | yes, dozens of them |
| Best for | noise, ripple, analog signals, signal quality | "what bytes were sent and when?" |
They complement each other; see oscilloscope basics for the other half.
What you need
- An 8-channel USB logic analyzer (24 MHz, often labeled "Saleae compatible"; based on the Cypress FX2 chip).
- PulseView, the free, open-source software from the sigrok project (Windows, macOS, Linux).
- The small grabber clips (or jumper wires) that come with it.
These cheap analyzers handle 0–5 V logic, so they work with both 5 V Arduinos and 3.3 V boards. Never connect them to higher voltages.
Setup
- Install PulseView from the sigrok website.
- On Windows, the first time, run the Zadig tool included with PulseView and install the WinUSB driver for the analyzer (it may show as "Unknown device" or "fx2lafw").
- Open PulseView, choose the device fx2lafw (generic driver for FX2 based LAs) and click Scan.
- Connect the analyzer's GND to your circuit's GND. This is essential; without it the readings are garbage.
- Connect channels to the signals you want to see, e.g. CH0 → SCL, CH1 → SDA.
Choosing the sample rate
The analyzer takes snapshots of each channel many times per second. To capture a signal reliably, sample at at least 4 times its fastest frequency, and ideally 10 times:
| Signal | Speed | Sample rate to use |
|---|---|---|
| Serial at 9600 baud | ~10 kHz | 1 MHz |
| Serial at 115200 baud | ~115 kHz | 2–4 MHz |
| I²C at 100 kHz | 100 kHz | 1–2 MHz |
| I²C at 400 kHz | 400 kHz | 4–8 MHz |
| SPI at 4 MHz | 4 MHz | 24 MHz (the maximum, borderline) |
Higher rates fill the memory faster, so the capture is shorter. Set the number of samples so the capture covers the event (e.g. 1 M samples at 2 MHz = 0.5 s).
Your first capture: an I²C scanner
Upload the I²C scanner sketch from the I²C guide with an OLED or sensor connected. Then:
- CH0 → A5 (SCL), CH1 → A4 (SDA), GND → GND.
- Sample rate 2 MHz, 5 M samples.
- Set a trigger on CH1 (SDA) falling edge, so the capture starts at the first I²C "start" condition.
- Click Run, then press the Arduino's reset button.
- Click the decoder icon, add I²C, and assign SCL = CH0, SDA = CH1.
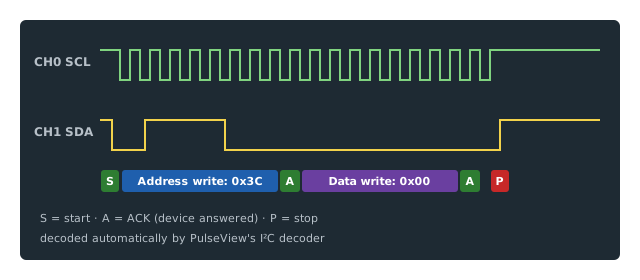
You'll see the scanner trying addresses one by one. Most get a NACK (nobody home); your device's address gets an ACK. If the scanner finds nothing, the capture tells you why: no clock at all (wiring), or every address NACKed (the device isn't powered or is on other pins).
Decoding serial (UART)
Connect a channel to the Arduino's TX (pin 1), add the UART decoder, set the baud rate to match Serial.begin(), and you'll see the text your sketch prints. This is handy for debugging a module that talks serial, like a GPS or the HC-05 in the Bluetooth robot car, while the USB Serial Monitor is busy.
Decoding SPI
SPI uses four lines: SCK (clock), MOSI (data from Arduino), MISO (data back) and CS (chip select). Connect all four, add the SPI decoder and assign them. On an Uno they're pins 13, 11, 12 and your chosen CS pin. The RC522 reader in the RFID door lock is a good thing to look at.
Other tricks
- Timing measurements: put markers on two edges to measure exactly how long your code takes between two
digitalWrite()calls. Great for checking interrupt response or loop speed. - Servo and PWM: see the pulse width of every servo channel at once.
- Button bounce: capture a press at 1 MHz and count the bounces.
Limitations
- It can't show voltage levels: a weak, noisy 2.5 V "high" looks the same as a clean 5 V high. If decoding gives random errors, check signal quality with an oscilloscope.
- 24 MHz is the ceiling for these cheap units, too slow for fast SPI displays or USB.
- Long grabber wires pick up noise; keep them short and use a good ground connection.
A note on software
Some clone analyzers are sold with instructions to use a commercial brand's software. That software is meant for the brand's own hardware. PulseView is free, open source and made to support these generic analyzers, so use it.
— TheSolderBench · found a mistake? tell me